
A clean structure tool for traders who want higher-timeframe context
without drawing levels manually or switching timeframes.
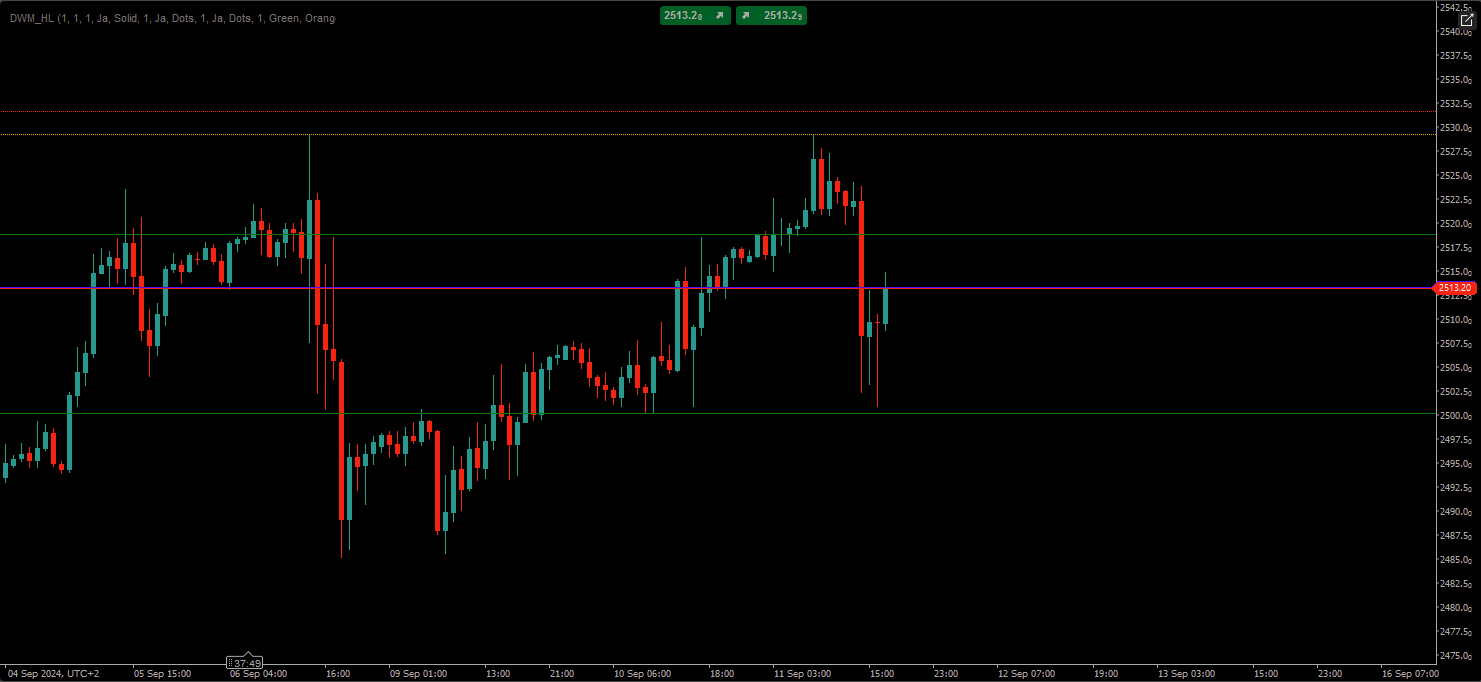
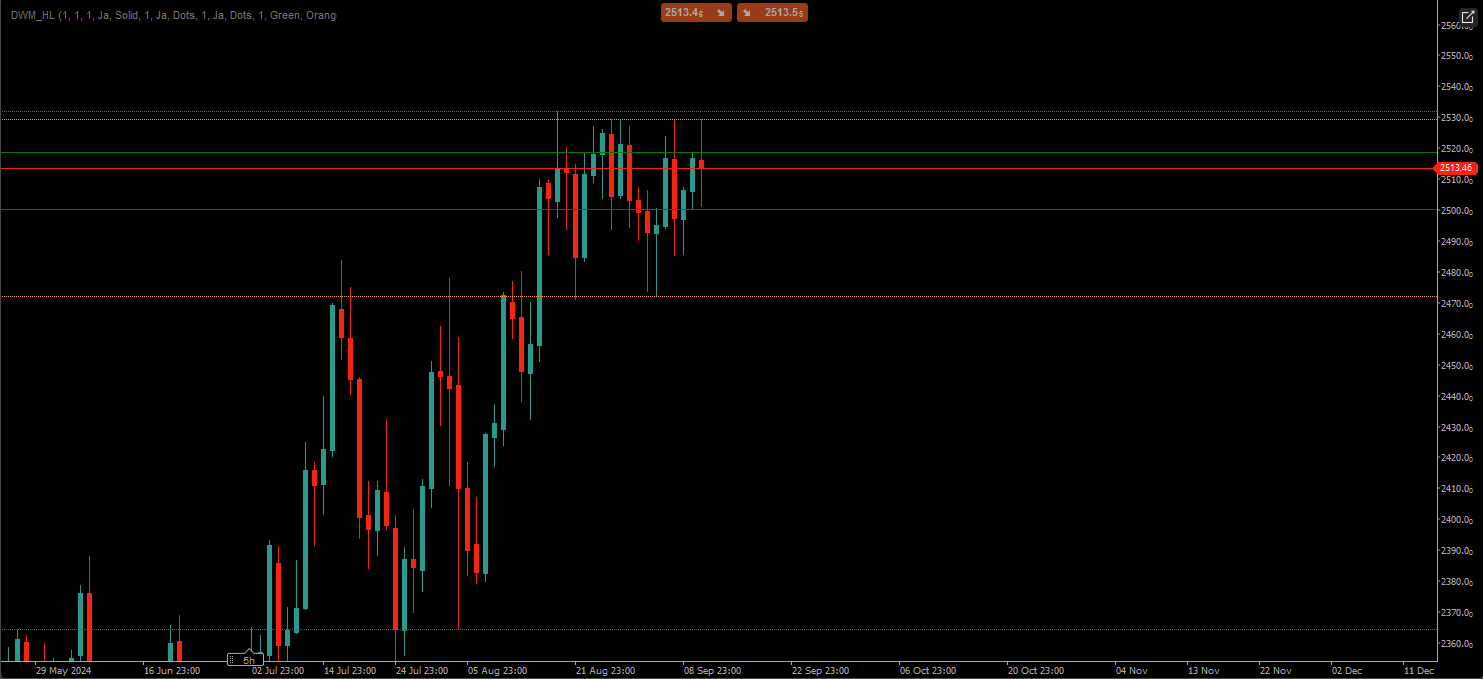
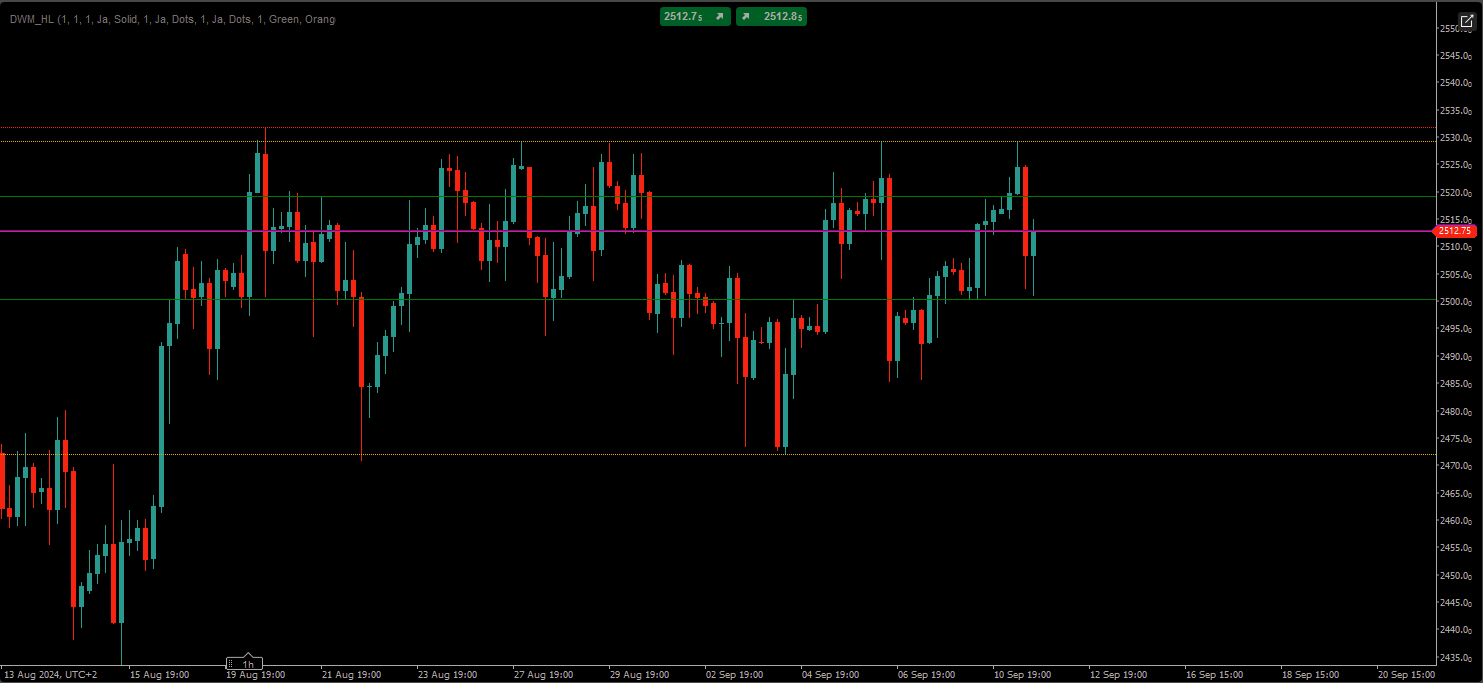
• See higher-timeframe structure directly on lower timeframes
• Identify reaction zones and important price extremes
• Avoid trading blindly into Daily, Weekly or Monthly levels that often act as reaction or rejection zones.
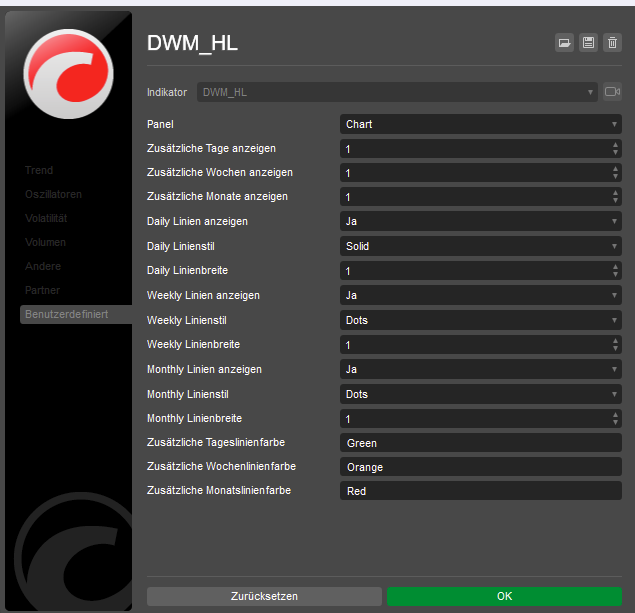
• Automatic Daily, Weekly and Monthly High & Low levels
• Non-repainting
• Custom colors and visibility options
• Works on all markets (FX, Indices, Crypto)
• Clean and minimal chart display
• A structure and context tool
• Designed for discretionary traders
• Platform-agnostic and lightweight
• No signals
• No strategy
• No profit promises
No subscription · Lifetime access
Instant download after purchase.
Includes MT5 and cTrader versions
This tool provides market structure only.
It does not give trade signals or financial advice.
We use cookies and similar technologies to provide the best experience, analyze site traffic, and personalize content. By clicking "Accept", you agree to the use of these technologies. You can manage your preferences at any time in the settings.