
NGS Liquidity Levels
Automatically display Daily, Weekly and Monthly highs and lows across timeframes. Keep the reference prices that matter visible—without redrawing them manually.
Lifetime access · cTrader or MetaTrader 5
Important levels become useless when they are inconsistent.
Manually drawing previous highs and lows takes time, creates clutter and often leads to different reference points across charts and timeframes.
Manual chart work
Repeatedly drawing and updating levels wastes time before the analysis even begins.
Inconsistent context
Different timeframes can quickly become disconnected when reference levels are not standardized.
Too much visual noise
Overloaded charts make it harder to see the levels that actually matter.
One consistent liquidity map across your charts.
NGS Liquidity Levels automatically plots the previous Daily, Weekly and Monthly highs and lows so you can focus on reaction, acceptance and execution.
Built for clarity, not chart clutter.
Track the previous session’s most relevant short-term reference prices.
Add broader context for multi-day structure and liquidity interaction.
Keep higher-timeframe reference prices visible for larger market moves.
Use the same levels on lower and higher timeframes without redrawing them.
Adjust visibility, style and settings to match your workflow.
Works as context for breakouts, reversals, trend continuation and mean reversion.
See the same liquidity structure across timeframes.
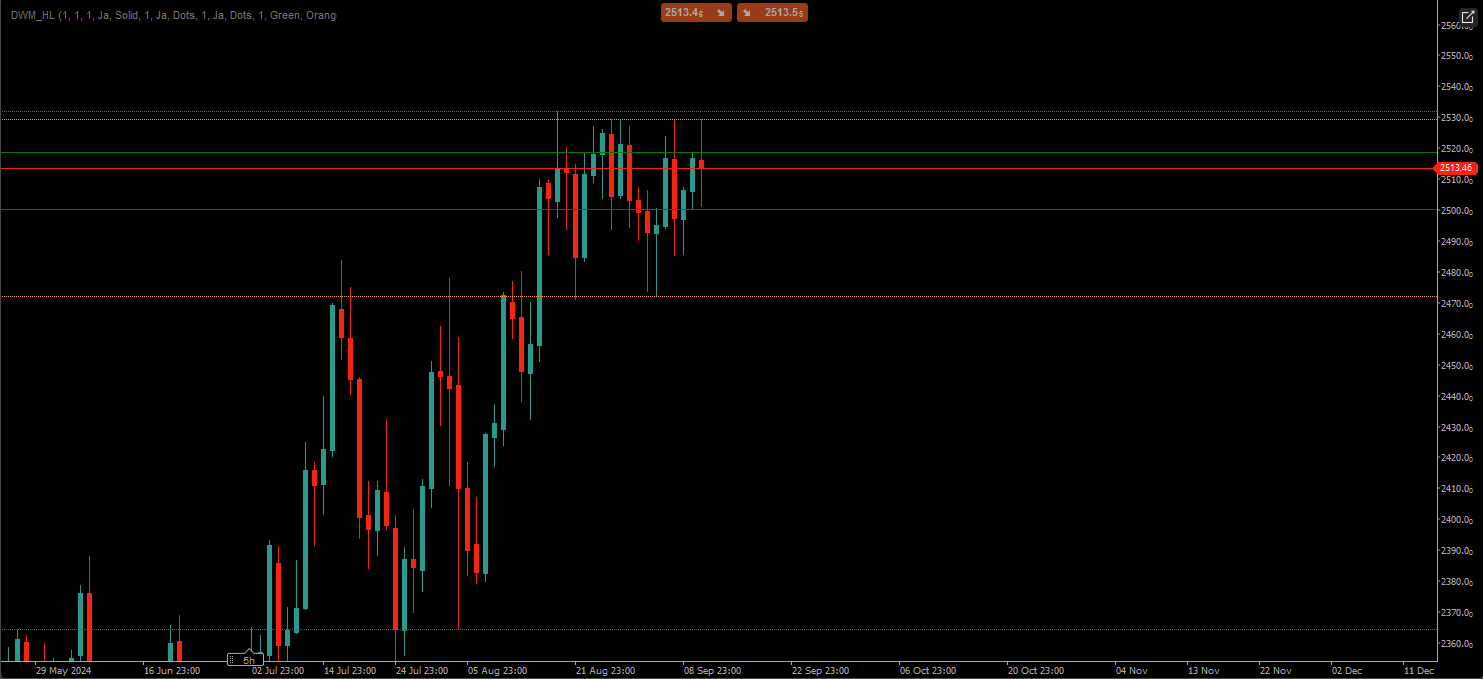
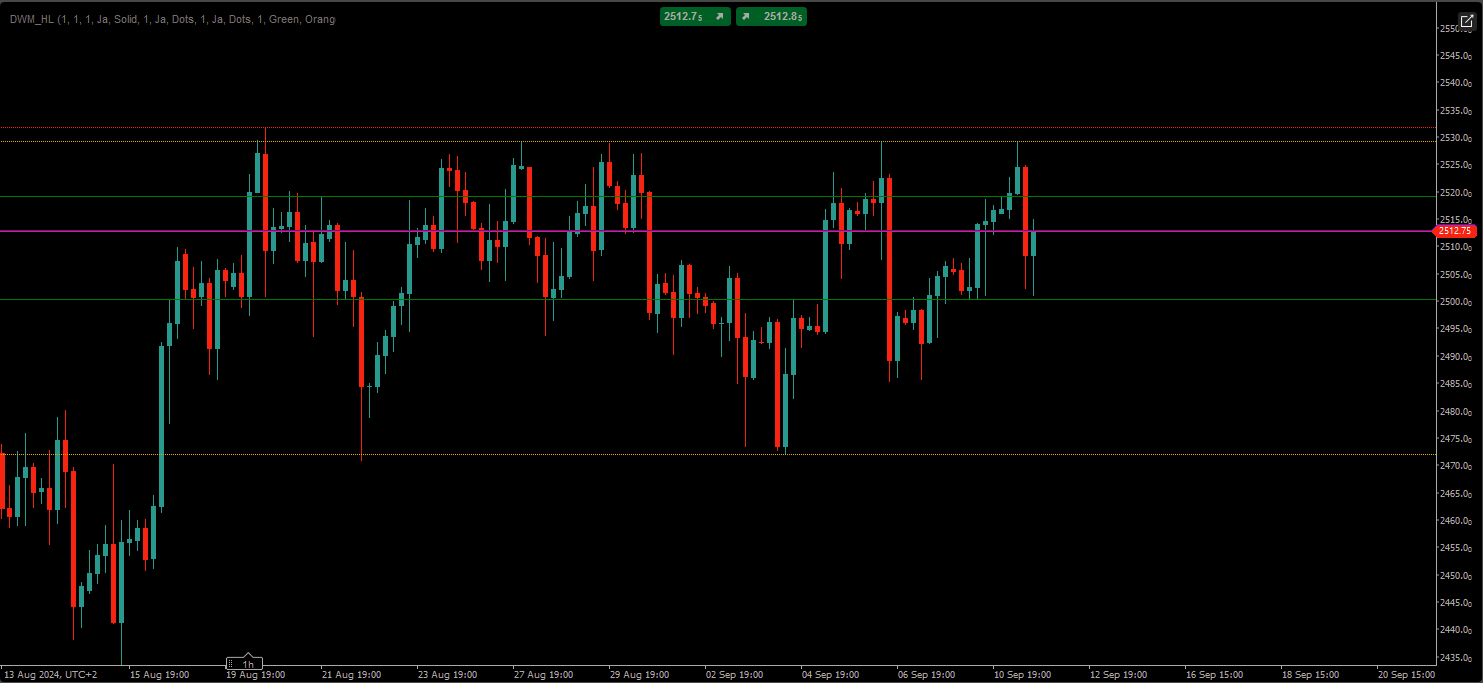
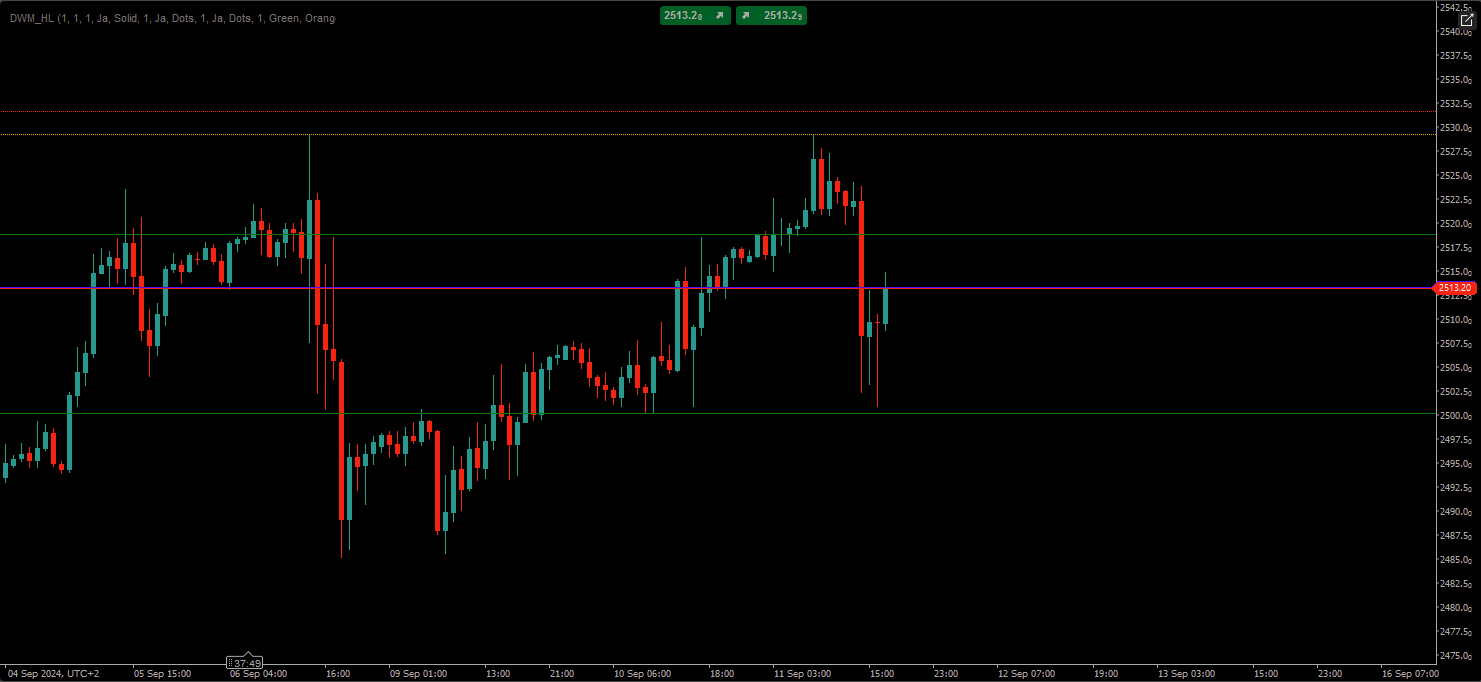
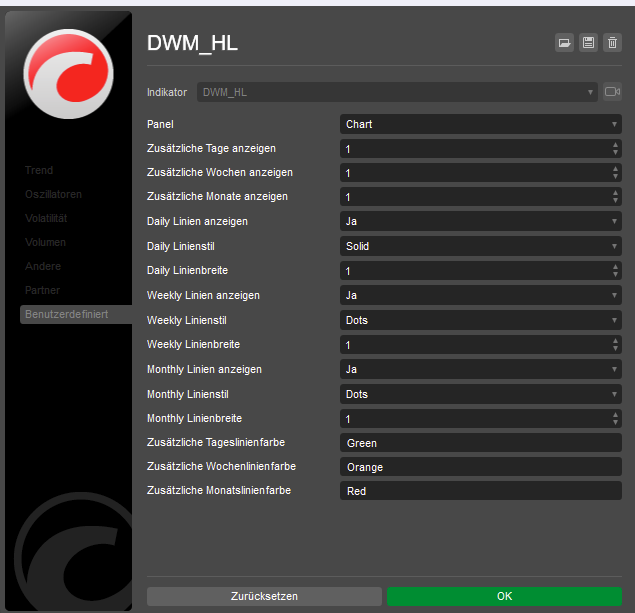
Configure the display around your own process.
Keep the chart clean by deciding which levels should remain visible and how they should appear.
- Control level visibility
- Adjust line styles and appearance
- Adapt the tool to different timeframes
- Keep only the information relevant to your process
One tool inside a five-part decision process.
NGS Liquidity Levels supports the Liquidity area of the NGS Framework. The other four areas still determine context, execution and risk.
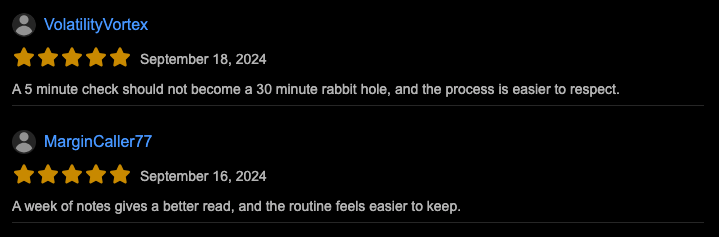
What traders say.
Real customer feedback provides a clearer view of how the indicator performs in practical use—without relying on static sales counters or inflated claims.
Who this tool is, and is not for.
Built for traders who...
- Use previous highs and lows in their analysis
- Want consistent reference levels across charts
- Trade breakouts, reversals or continuation
- Value structure over prediction
Not built for traders who...
- Expect automatic entries or trade signals
- Want guaranteed reversals at every level
- Do not use risk management
- Prefer completely discretionary, unstructured charts
One product. Two platform versions.
Both versions are priced equally and support the same core liquidity framework.
NGS Liquidity Levels
Available through the cTrader Store.
$49
One-time purchase · Lifetime access
Buy on cTraderNGS Liquidity Levels
Available through the MQL5 Market.
$49
One-time purchase · Lifetime access
Buy on MQL5Understand the concept behind the tool.
Liquidity
Learn why previous highs, lows and key reference prices matter.
Open Framework → EducationNGS Reading List
Five books selected to deepen the five Framework areas.
View Books → AssessmentFind Your Blind Spots
Measure your understanding across all five Framework categories.
Take the Assessment →Keep Daily, Weekly and Monthly liquidity visible.
Choose your platform and add a consistent liquidity structure to your chart workflow.
Liquidity Levels FAQ
What does NGS Liquidity Levels display?
It automatically displays previous Daily, Weekly and Monthly highs and lows.
Does the indicator provide entry signals?
No. It provides structured reference levels. Entries and risk decisions remain part of your own strategy.
Can it be used for breakouts and reversals?
Yes. The tool is strategy independent and can support breakout, reversal, continuation and mean-reversion frameworks.
Is it available for cTrader and MetaTrader 5?
Yes. Separate versions are available through the cTrader Store and MQL5 Market.
Is the price recurring?
No. The current price is $49 as a one-time purchase for the selected platform version.
Does the tool replace the NGS Framework?
No. It supports the Liquidity area. Market Structure, Macro, Risk & Execution and Market Behavior still matter.